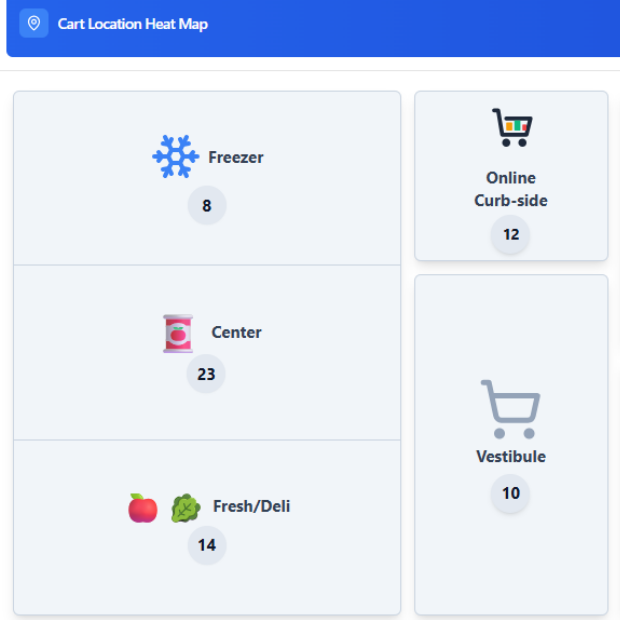
See where your carts cluster — and where they go missing — across every store zone.
Vestibule pile-ups, curbside backups, abandoned fresh-deli carts.
Aisles where your carts never go — usually means a store-layout problem.
When the peak is. When it isn't. How long a peak actually lasts.
Use both views together: the heat map shows distribution; utilization shows fleet size you actually need.